


- AR (augmented reality)
- sound source
- video
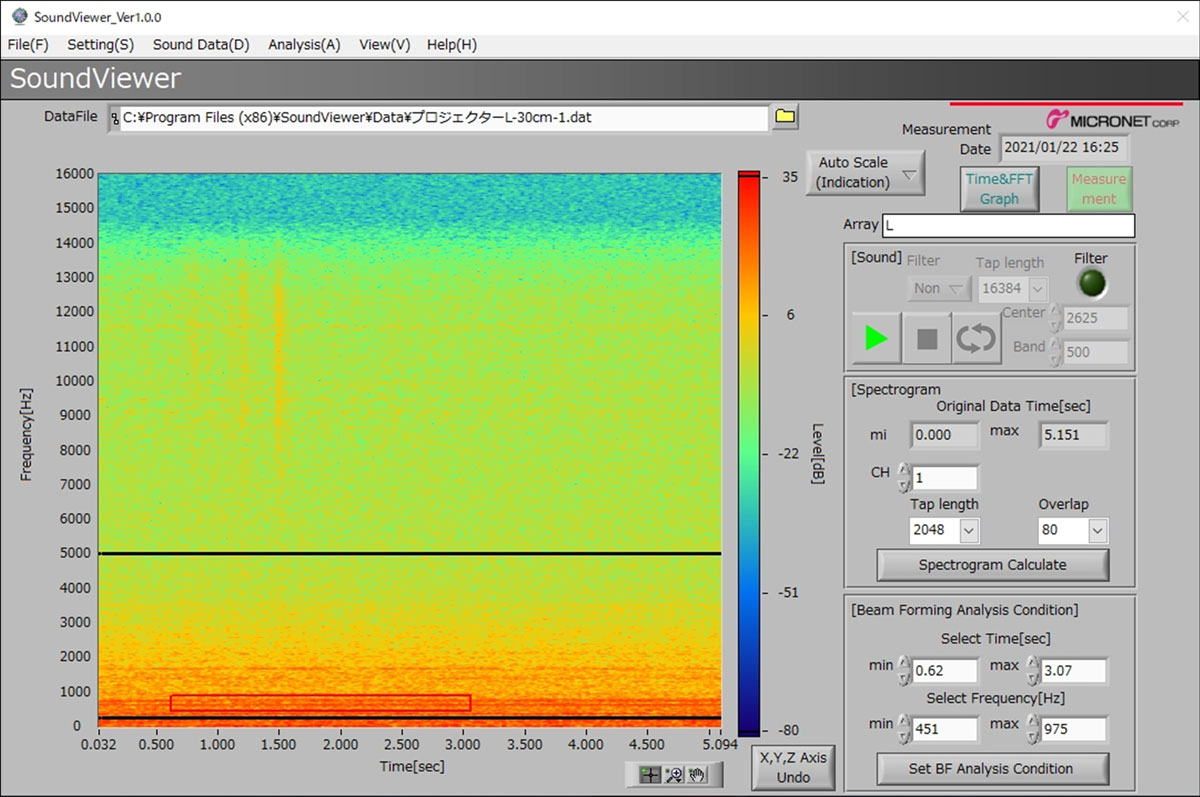
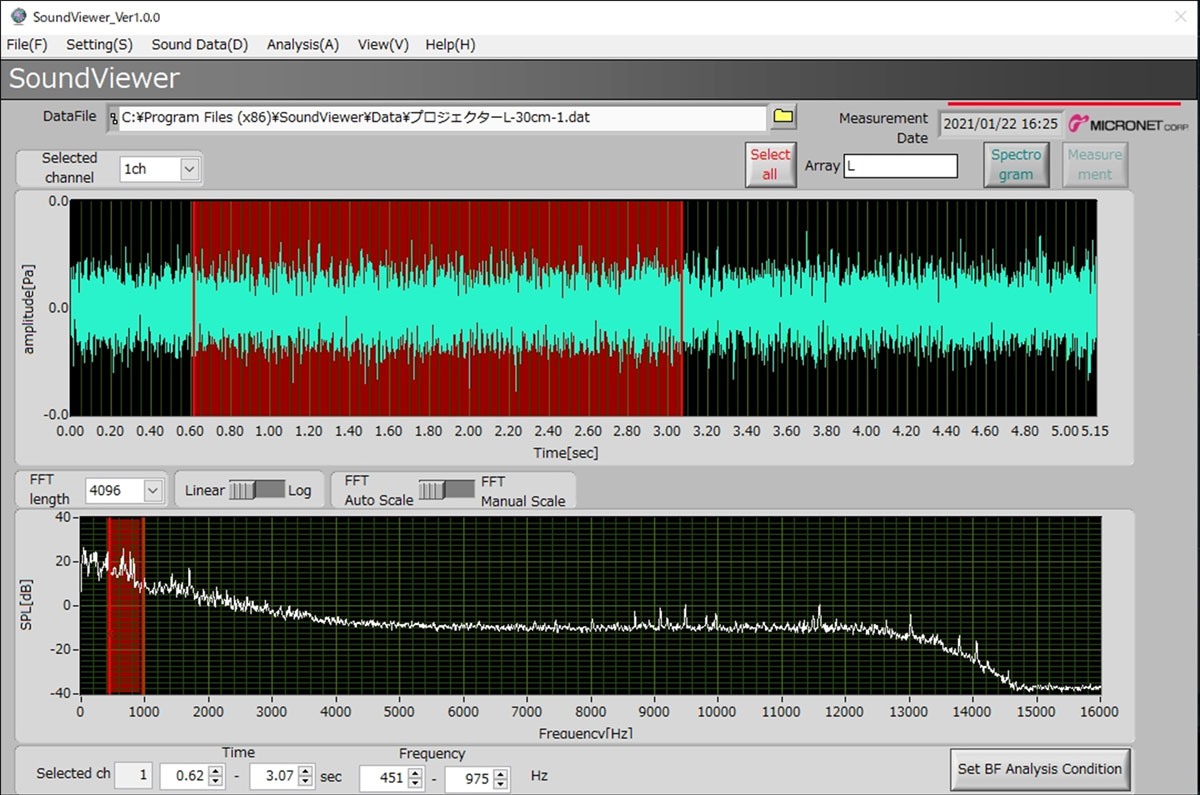
- visualization
- frequency
- abnormal noise
- countermeasure
- low-frequency
- high-frequency
- microphone array
- variable

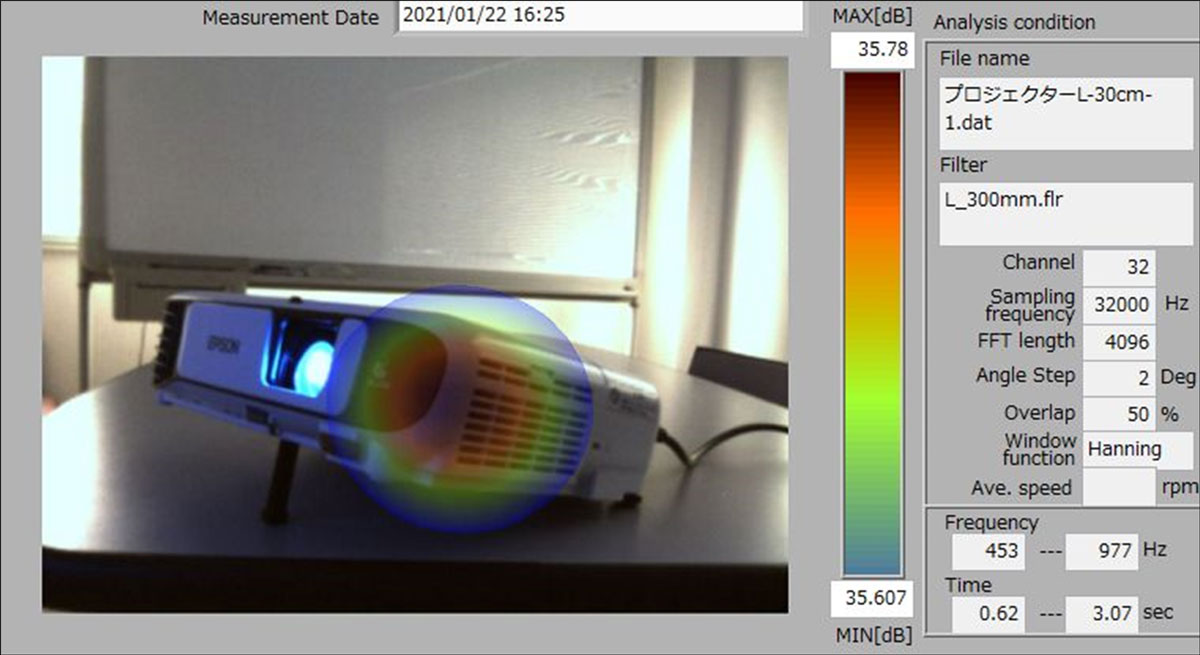
Using a camera installed in the center and visually displaying the magnitude of the sound pressure level measured by the microphone as contour lines superimposed on the image of the object being measured, this technology enables the visualization of sound sources for abnormal noise that cause problems at development worksites. By visualizing the parts that require countermeasures, this technology enables problems to be shared between the worksites where abnormal noise occurs and design groups, as well as problem-solving at an early stage.
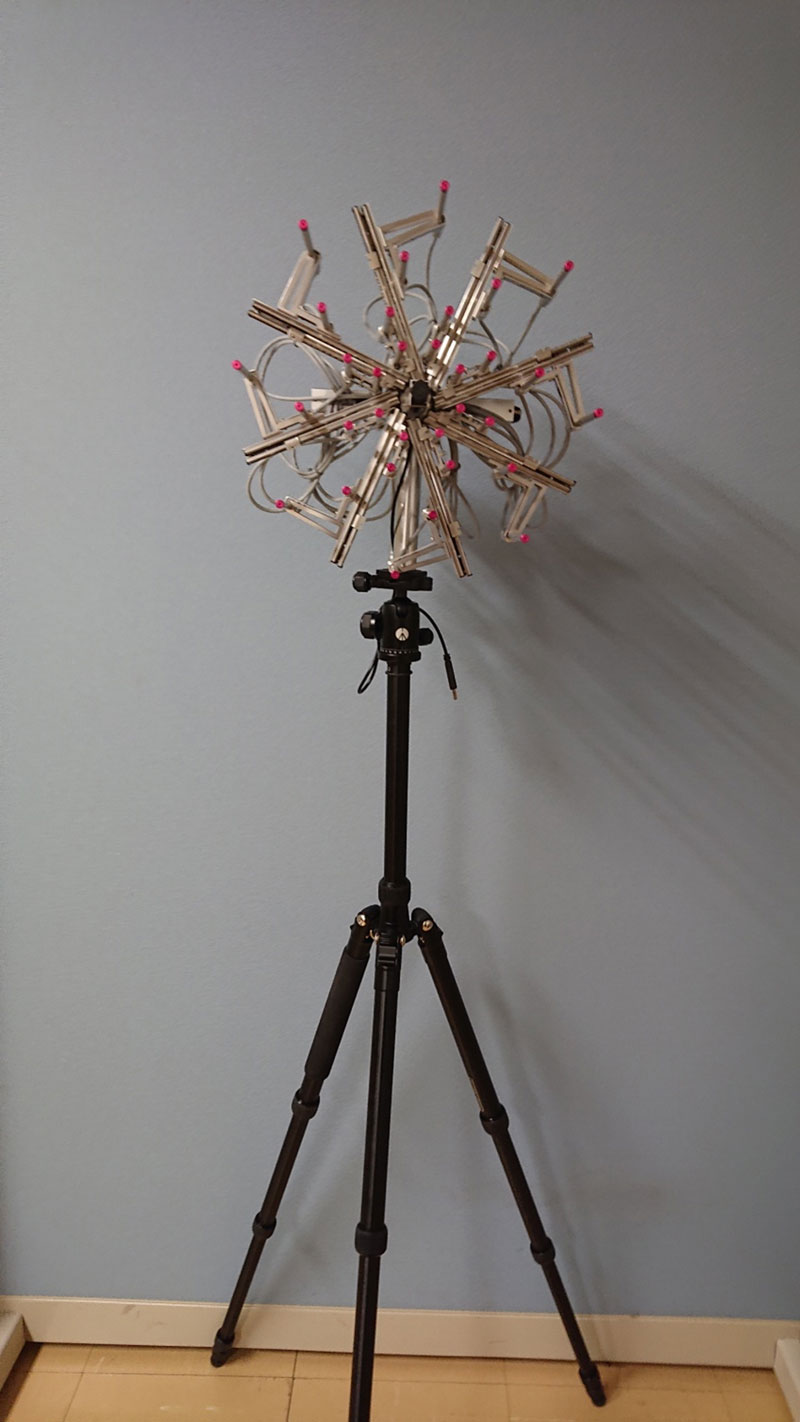
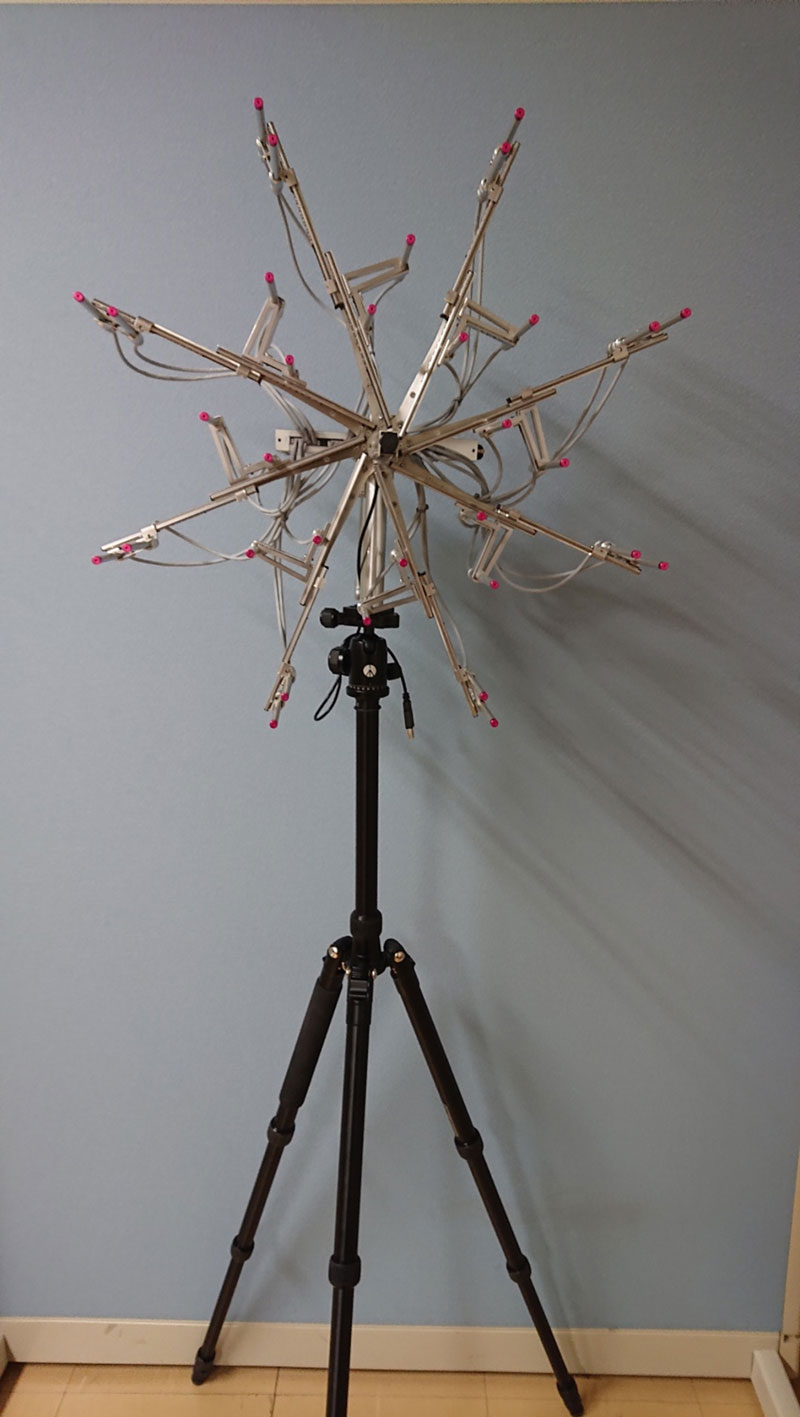
・Addresses a wide range of frequencies using a variable microphone array
The use of a variable microphone array enables one device to identify locations that generate abnormal noise over the low- to high-frequency range.
・Compact design and reduced costs
The device can be stored in a compact manner and is also easy to carry. Equipped with a microphone array that can pickup both low- and high-frequencies, a single unit can be used for both ranges, which reduces costs.
・Applicable to a variety of situations
This device is expected to be used in a wide range of situations, including for abnormal noise at development worksites, abnormal noise in production equipment, ventilation noise in air conditioners, creaking in building structures and abnormal noise due to member expansion, abnormal parts on production line equipment, and indoor noises in residences.

・Features
Nissan's in-house developed micro microphone array and AD converter were separated, but Micronet's product was integrated into a compact product.
Moreover, Macronet not only sells the licensed product but also offers rental services, making it possible to provide optimal solutions for various noise problems.
・Equipment appearance
sound source frequency: 1kHz ~ 12kHz
sound source frequency: 250Hz ~ 5kHz
Contact information about this technology

The products on the linked site are licensed by Nissan and the licensee company is responsible for the products.